Solving 1- and 2-step problems using scaled bar graphs

 Do you want to learn faster and more easily?

Basics on the topic Solving 1- and 2-step problems using scaled bar graphs
Bar Graph Problems
Gathering information from bar charts is a common task in maths lessons. You will be asked to answer questions containing keywords like “how many more” or “how many less” and you will be asked to analyse the data. This text will teach you how to solve bar graph interpretation questions.
How to Solve Bar Graph Problems
We can use information in bar graphs to analyse questions about the total number and answer questions containing words like “how many more” or “how many less” for each category. When finding out “how many more” or “how many less”, we are looking for a difference between values. Let’s learn how to solve these one and two step bar graph word problems.

Bar Graph Problems – Questions
When faced with a bar graph and questions, read the question and find keywords like “how many more” or “how many less” or “how many fewer”. These hint at a difference between two things which implies a subtraction equation. Next, locate the first data point on the graph. Carefully use the scale to determine the height of the bar. This is important because the bar graph is scaled, so one interval represents more than one unit in value. Let’s use an example. If the scale goes up by ten and the bar is halfway between thirty and forty, the value of the bar is thirty-five. Thirty-five is halfway between thirty and forty.

Next, repeat these steps to find the value of the second data point from the question. Once both values are known, set up the subtraction equation. In bar graph problems, typically the larger number is written first and the smaller number is subtracted from it. Finally, solve for the difference. Now you have solved a one-step bar graph word problem.

Bar Graph Problems – Examples
Similarly, read the question and find keywords like “how many more” or “how many less” or “how many fewer”. But this time, a two-step problem will include words like together or combined. These words tell us to find a sum of two items before we can find an overall difference. This makes it a two-step problem. We will need to write and solve the first equation before we can write and solve the second one.

Similarly, locate the specified data on the graph by using the scale to determine the height of the bar. This is important because the bar graph is scaled, so one interval represents more than one unit in value. Next, do the same to find the value of the second data point from the question. Once both values are known, set up an addition equation. Remember, the key words combined or together told us to find a total before finding a difference. Add the value of the first two items to find the sum.

With part one complete, move on to part two. Here we are looking for “how many less” which tells us to set up a subtraction problem. Locate the third data point and use the key to determine its value. Write an equation with the sum from part one and subtract the value of the third data point from it. The difference is the solution to the two part problem.


Bar Graphs Problems – Steps for Answering Questions
This video about bar graph problem solving and interpretation of bar graph data presented the necessary steps for solving questions about values on bar graphs. Here are all the essential steps listed in a chart:
| Step # | What to do |
|---|---|
| 1 | Find the keywords in the problem. |
| 2 | Locate the data on the graph. |
| 3 | Set up the equation and solve the problem. |
Have you practised yet? On this website, you can also find a bar graph questions worksheet with one and two step word problems. These worksheets include bar graph questions and answers. Also, have a look at our interactive exercises and activities.
Transcript Solving 1- and 2-step problems using scaled bar graphs
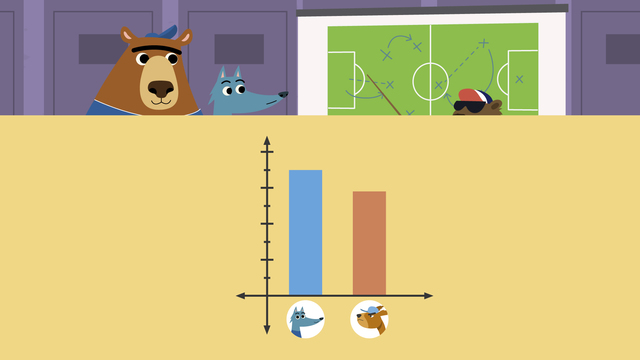
Nari and Gus couldn't be more excited to start the new football season! Mr Beaver, their coach, is reviewing last season's data to build the new team. Using a scaled bar graph, Nari and Gus will help analyse the team's scoring record by answering the coach's questions. "Solving One- and Two-Step Problems using Scaled Bar Graphs". Remember, when solving 'how many more' or 'how many less', we are looking for a DIFFERENCE between values. First, the coach wants to know how many more goals did Nari score than Squirrel? First, we find the key words 'many more'. These words imply a difference, so we will write a subtraction equation. To find the difference, we first need to find out how many goals Nari and Squirrel each scored. Let's start with Nari. His bar is HALFWAY between thirty and forty, so he scored thirty-five goals. Next, we find Squirrel's bar. Since Squirrel's bar is just below thirty but well above twenty-five, it is reasonable to guess that she scored twenty-nine goals. Now we setup our subtraction equation. Remember, the coach wanted to know "how many more goals did Nari score than Squirrel". Nari's score thirty-five minus Squirrel's score twenty-nine equals. Then, we solve! Thirty-five minus twenty-nine equals six. We can tell Mr Beaver that Nari scored six more goals than Squirrel last season. Secondly, Mr Beaver wants to know "how many FEWER goals did Rabbit and Gus score together compared to Mouse?" To begin, we find the key words in our question: 'many fewer', 'Rabbit Gus together', and 'Mouse' . The key word TOGETHER tells us that we will need to find the SUM of Rabbit and Gus' goals BEFORE we can subtract it from Mouse's goals. This makes it a two step problem, but we can still follow the same process as before. First, look at the graph. How many goals did Rabbit score? Rabbit scored eleven goals. How many goals did Gus score? Gus scored zero goals. Remember, Coach Beaver wanted to know how many fewer goals Rabbit and Gus scored together compared to Mouse? The key word, TOGETHER, tells us we need to find the total of Rabbit and Gus's goals. Step one will be setting up an addition equation. Rabbit's goals, eleven, plus Gus's goals, zero, equals. Eleven plus zero equals eleven goals scored together. We have completed step one, so we can move on to step two. How many goals did Mouse score? He scored thirty-five goals. In step two we are looking for HOW MANY FEWER, which tells us we are going to setup a subtraction problem now. Starting with our larger number, we write thirty-five minus eleven equals. Let's solve how many fewer goals did Rabbit and Gus score than Mouse? They scored twenty-four fewer goals than Mouse. Before we find out the starting line up, let's remember, to solve one and two step problems using a scaled bar graph: First, FIND the key words. Secondly, identity the needed values on the graph. The third step is to setup the equation. And finally, solve. Repeat all the steps once more if it is a two part question. It looks like the coach has his team thanks to Gus and Nari's analysis! "Hey, Gus, why are you so sad?" "I didn't score any goals last year, Nari, there's no way the coach will put me in the team!" "Uhhh, Gus, you're not supposed to score. You're the GOALIE, of course you'll be on the pitch!" "OH YEAHHH!!"
Solving 1- and 2-step problems using scaled bar graphs exercise
-
Reading a scaled bar chart.
HintsLook at the axis and work out what the scale is counting in.
If the bar is halfway between the 2 numbers shown, then you will need to work out what number is halfway between.
SolutionFirst, work out the scale, this scale is counting in steps of 10. Then, look at the category. In this case, look at the specific animal and find the top of the bar. Then, trace your finger over to the left hand side to find its number.
If it is halfway between two numbers, then the number won't be shown and you will need to work out what number is halfway between.
Nari scored 25 goals. Rabbit scored 15 goals. Mouse scored 30 goals.
Squirrel scored 20 goals. Gus scored 5 goals.
-
How many more goals did Mouse score than Rabbit?
HintsLook at the axis and work out what steps the scale is counting in.
The question asks how many more goals did Mouse score than Rabbit. Think about what equation will help you solve this.
SolutionBy looking at the bar chart, we can see Rabbit scored 10 goals and Mouse scored 30 goals.
We need to work out how many more goals Mouse scored than Rabbit.
To find this out, you can subtract 30 - 10 = 20 or you can count up starting at 10 and ending at 30, which is also 20.
-
Coach Beaver needs your help!
HintsLook at the axis and work out what the scale is counting in.
Nari's score is just below the number shown on the bar chart. Work out which number is just before 30.
If the bar is between the two numbers shown, then you will need to work out what the number is.
Decide if you need to set up 1 or 2 equations to solve for the answer.
If the question asks how many more or how many fewer, think about what equation will help you solve this.
SolutionFor the third question:
- Looking at the bar chart, Rabbit scored 10 goals, Squirrel scored 15 goals and Mouse scored 35 goals.
- The first part of the question is to work out: how many goals did Rabbit and Squirrel score together? This means that we need to add their scores together. So, 10 + 15 = 25.
- The last part of the question is to work out: how many fewer goals did Rabbit and Squirrel score than Mouse? To find this, you can subtract 35 - 25 = 10 or you can count up starting at 25 and ending at 35, which is also 10.
For the second question:
- Looking at the bar chart, we can see Rabbit scored 10 goals and Mouse scored 35 goals.
- We need to work out how many fewer goals Rabbit scored than Mouse.
- To find this, you can subtract 35 - 10 = 25 or count up starting at 10 and ending at 35, which is also 25.
- Looking at the bar chart, we can see Nari scored 29 goals and Squirrel scored 15 goals.
- We need to work out how many more goals Nari scored than Squirrel.
- To find this, you can subtract 29 - 15 = 14 or count up starting at 15 and ending at 29, which is also 14.
-
Solve the word problems by looking at the bar chart.
HintsHere is what each image represents:
Look at the axis and work out what the scale is counting in.
If the bar is halfway between the two numbers shown, then you will need to work out what number is halfway between.
If the question asks how many more or how many fewer, think about what equation will help you solve this.
SolutionFor the third question:
- Looking at the bar chart, 5 players chose grape, 10 players chose banana, and 35 chose apple as their favourite fruit.
- The first part is to work out the total number of players who chose grape and banana. This means that we need to add them together. So, 5 + 10 = 15.
- The last part is to find out how many fewer players chose grape and banana than apple. To work this out, you can subtract 35 - 15 = 20 or you can count up starting at 15 and ending at 35, which is also 20.
For the second question:
- Looking at the bar chart, 35 players chose apple, 25 players chose kiwi, and 40 chose blueberry as their favourite fruit.
- The first part to work out is the total number of players who chose apple and kiwi. This means that we need to add them together. So, 35 + 25 = 60.
- The last part is to work out how many more players chose apple and kiwi than blueberry. To solve this, you can subtract 60 - 40 = 20 or you can count up starting at 40 and ending at 60, which is also 20.
- Looking at the bar chart, 10 players chose banana and 30 players chose orange as their favourite fruit.
- We need to find out how many fewer players chose banana than orange.
- To solve this, you can subtract 30 - 10 = 20 or count up starting at 10 and ending at 35, which is also 20.
-
How many more people voted for blue than yellow?
HintsThe question asks how many more people voted for blue than yellow. Think about what equation will help you solve this.
Look at the numbers on the axis to see how many people chose blue and yellow.
SolutionBy looking at the chart, we can see 6 people voted for blue and 4 people voted for yellow.
We need to work out how many more people voted for blue than yellow.
To find this, you can subtract 6 - 4 = 2 or you can count up starting at 4 and ending at 6, which is also 2.
-
Find the word problems that are solved incorrectly.
HintsHere is what each image represents:
Look at the axis and work out what the scale is counting in.
If the bar is halfway between the two numbers shown, then you will need to work out what number is halfway between.
Decide if you need to set up 1 or 2 equations to solve.
If the question asks how many more or how many fewer, think about what equation will help you solve this.
SolutionFor the first problem:
- We need to work out how many more people voted for pepperoni than bacon.
- To solve this, you can subtract 325 - 150 = 175 or count up starting at 150 and ending at 325, which is also 175, so this answer was correct.
- The first part of the question to work out is: how many people voted for onion and pepper. This means that we need to add them together. So, 200 + 150 = 350.
- The last part of the question is to find: how many more people voted for onion and pepper than mushroom. You can subtract 350 - 250 = 100 or you can count up starting at 250 and ending at 350, which is also 100, so this answer was correct.
- The first part of the question to work out is: how many people voted for tomato and onion. This means that we need to add them together. So, 50 + 200 = 250.
- The last part of the question to work out is: how many fewer people voted for bacon than tomato and onion. You can subtract 250 - 150 = 100 or you can count up starting at 150 and ending at 250, which is also 100, so this answer was incorrect.
- The first part of the question to work out is: how many people voted for tomato and pepper. This means that we need to add them together. So, 50 + 150 = 200.
- The last part of the question to work out is: how many more people voted for pepperoni than tomato and pepper. You can subtract 325 - 200 = 125 or you can count up starting at 200 and ending at 325, which is also 125, so this answer was incorrect.
- The first part of the question to work out is: how many people voted for mushroom and onion. This means that we need to add them together. So, 250 + 200 = 450.
- The last part of the question to work out is: how many fewer people voted for bacon than mushroom and onion. You can subtract 450 - 150 = 300 or you can count up starting at 150 and ending at 450, which is also 300, so this answer was incorrect.


